US Store Spend Intelligence
See the real sales
of any store
in the United States.
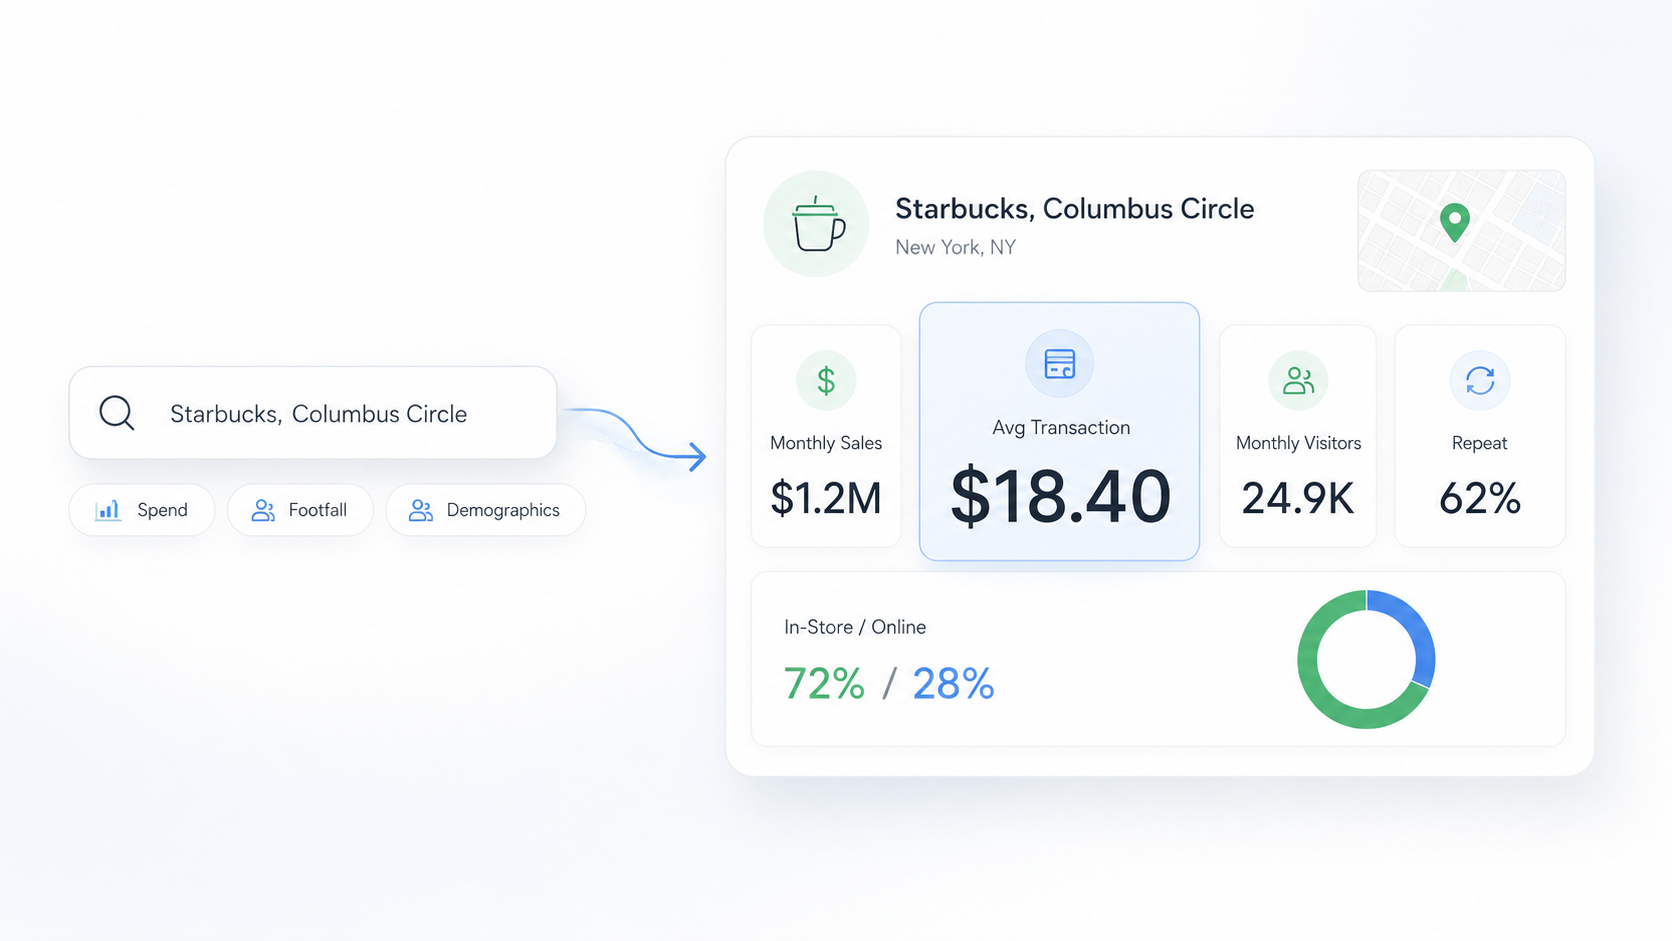
Type a brand name or address. Get monthly sales, average transaction value, and basket size for any US location in seconds. Footfall and visitor demographics included. No data team. No enterprise contract.
90M+
US locations covered
Monthly
Sales refresh cadence
< 3 sec
Time to first answer
Join 1,200+ retail operators, investors, and analysts on the waitlist.
|
24,900 monthly visitors · Columbus Circle Starbucks·↑ 18% YoY spend growth · Times Square McDonald's·$47.20 avg transaction · SoHo Rag & Bone·62% repeat customers · Whole Foods Tribeca·↑ 340% footfall spike · Event weekend · Barclays Center·Top cross-visit: Home Depot → Lowe's · 34% of customers·$2.1M monthly sales · Walmart Supercenter · Jersey City·28% above category ATV · Erewhon · West Hollywood·24,900 monthly visitors · Columbus Circle Starbucks·↑ 18% YoY spend growth · Times Square McDonald's·$47.20 avg transaction · SoHo Rag & Bone·62% repeat customers · Whole Foods Tribeca·↑ 340% footfall spike · Event weekend · Barclays Center·Top cross-visit: Home Depot → Lowe's · 34% of customers·$2.1M monthly sales · Walmart Supercenter · Jersey City·28% above category ATV · Erewhon · West Hollywood·
use cases
The questions that used to take
weeks now take seconds.
What is the monthly sales volume and average transaction value for the Walmart on Flatbush Ave, Brooklyn?
Walmart Supercenter. Flatbush Ave, Brooklyn
NAICS: General Merchandise Stores
Monthly Sales
$0
↑ +7% YoYAvg Transaction
$0.00
↑ +3% vs categoryMonthly Visitors
0
↑ +5% MoMIn-Store Share
0%
→ 12% onlineATV of $58.40 is 12% above the general merchandise category benchmark of $52.10 for the New York metro. Repeat visitor rate of 54% is above the 48% category average, signalling strong local loyalty.
0+
Operators on the waitlist
< 3 sec
Average time to first result
0
Live data connectors
0%
Gross margin per cached query
faq
Common questions.
InsightHub connects to an aggregated, anonymised panel of debit and credit card transactions across the US, covering 90M+ points of interest. The data is not individual level. It is aggregated to place and month, covering metrics like total spend, transaction count, median basket size, and customer frequency. Privacy is preserved at the source.